


DRIVING education platform Zutobi included the Philippines among the countries in the world where getting behind the wheel for learners involved extra stress due to several prevailing factors.
Zutobi analyzed several factors, like how easy the process is, the safety and congestion of the roads, and the costs involved with things such as fuel and buying the first car.
The four factors are congestion, road traffic deaths, registered vehicles, and road quality score. The compnay gave each a normalized score out of 10 before taking an average across all four scores. The parameters became the basis for coming up with a global list where it is the most stressful for learners, and where they’re more likely to ace their driving test.
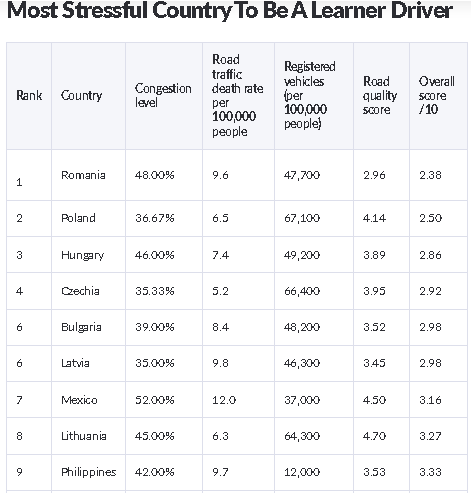
The Philippines scored a mean of 3.33 out of 10 after faring poorly in road traffic death rate and road quality.
Of the list, the country actually had the lowest number of registered vehicles per 100,000 people. However, the Philippines registered higher death rates than Romania, Poland, Czechia, Bulgaria, Hungary, and Lithuania.
Best countries for learner drivers
At the other end of the spectrum, the best countries for learning to drive include:
Singapore (8.87 out of 10) – Despite moderate congestion of 29%, Singapore excels with excellent road quality (6.45/100) and the lowest road traffic death rate among analyzed countries at just 1.9 per 100,000 people.
Sweden (8.28 out of 10) – With low congestion (22%), a low death rate (2.1 per 100,000), and good road quality (5.57/100), Sweden provides an excellent environment for learner drivers.
Netherlands and Denmark (7.56 out of 10 each) – Both countries offer strong road infrastructure, low death rates (3.4 and 2.3 per 100,000, respectively), and manageable congestion levels.
Methodology
Zutobia ranked each country on the following four factors, giving each a normalized score out of 10 for each, before taking an average across all four scores.
Congestion
The congestion level according to TomTom’s 2024 Traffic Index. This percentage shows the additional time that a journey would take in each city when compared to free-flow conditions.
Road traffic deaths
The mortality caused by road traffic injury (per 100,000 population) according to the World Population Review.
Registered vehicles
The number of registered vehicles (per 100,000 population) according to the World Population Review.
Road quality score
The quality of road infrastructure scores out of 100 according to the World Economic Forum’s Global Competitiveness Report.